
Three Questions With: Jill Libby, Sr. Data Management Specialist
 Jill Libby is a Senior Data Management Specialist who also serves as Team Leader for our firm’s Data Management team. Jill and her team serve as support to our project teams, improving processes in data collection and management to facilitate detailed analysis and visualization.
We recently spoke with Jill about her work in data management:
Q: How do you use data collection and analysis to generate insights and inform evidence-based decisions?
A: There’s a lot of data that we collect during a project, and with our data management team, we can put that data to good use over the course of a project.
For example, we have PFAS projects where we can analyze the temporal and spatial trends of various PFAS compounds, and this allows us to model contamination across a site.
Q: Can you give an example of how data management works in the context of an environmental project?
A: We often work with large and complex sites that have a lot of potential data sources. In this case, our team can help by condensing this data into a single endpoint using GIS or CAD.
For our Site Assessment & Remediation teams, we assemble historical and current data to develop detailed site plans integrated with sampling data and regulatory criteria. This helps the project team to develop a remediation strategy that is best for the client and the environment.
Q: How have you worked with our teams to improve their internal processes using data management?
A: It’s been a consistent process of automating and streamlining. I always say, “If you find yourself doing the same task five times or more, call me, and we’ll try to automate it.”
This has improved our process when it comes to the data from laboratories, for example. We’ve developed the use of programs that allow us to digitally interpret the sample results, which saves staff time and enables a more detailed understanding of the data.
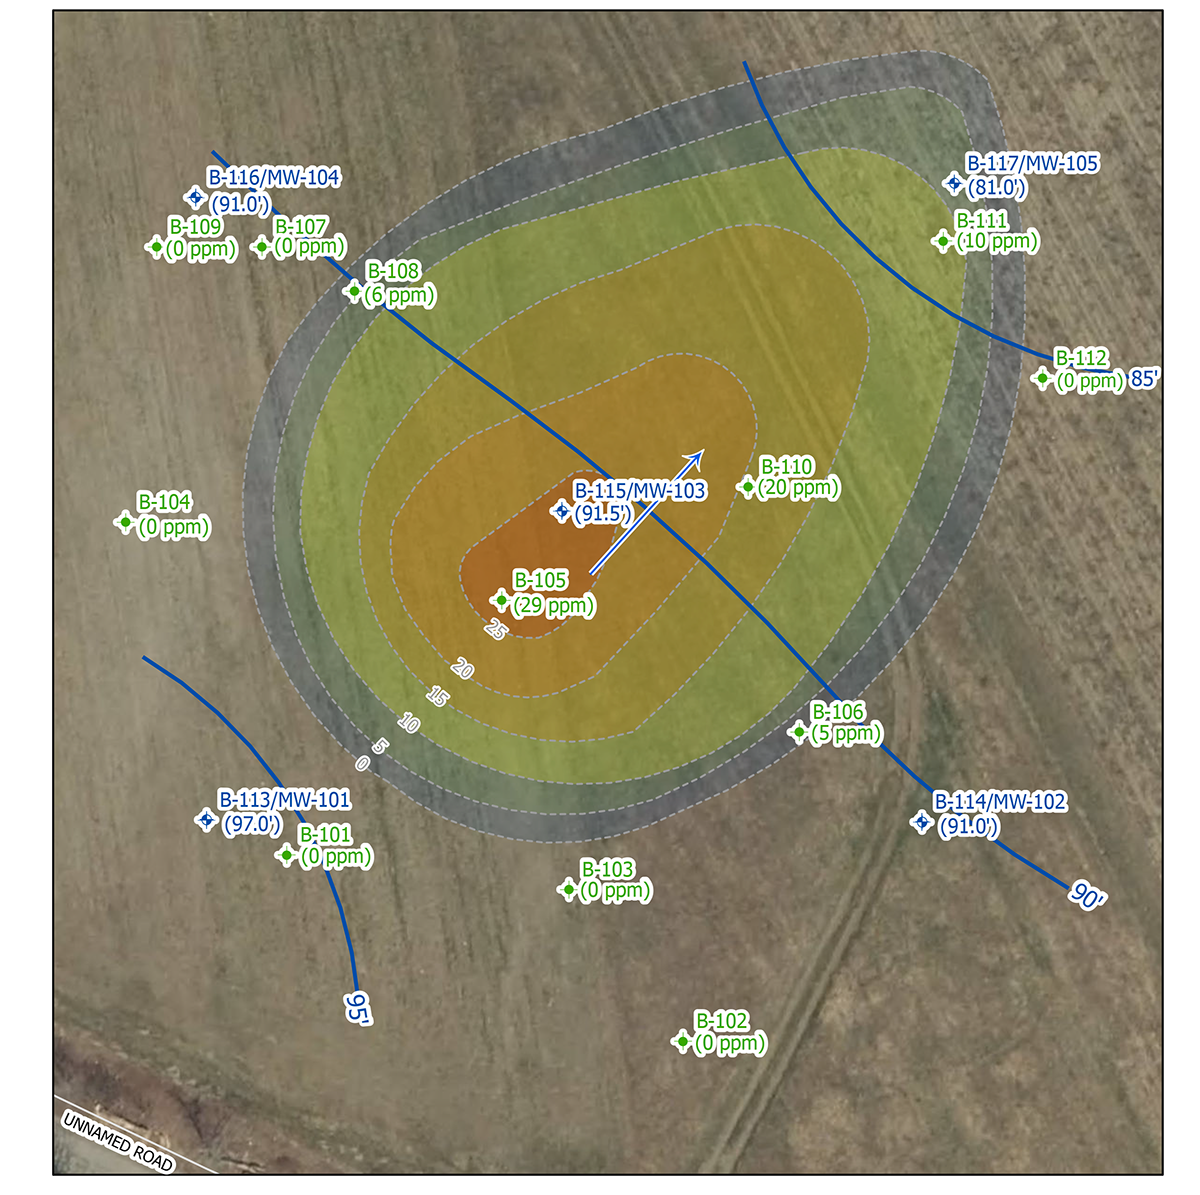
This graphic shows fan example contamination plume that summarizes a large data set into an easy to understand visualization. This graphic was created for demonstration and does not represent an actual site.